

Why Your Small Business Website Is Bleeding Customers (And It’s Not What You Think)
You’ve invested time and money into your website. The design looks professional. The copy is solid. You’re running ads. But the leads aren’t coming in the way they should — and if you dig into your analytics, the story becomes painfully clear: visitors are landing on your site and leaving within seconds.
Most business owners blame the design or the offer. The real culprit, more often than not, is speed.
Website speed optimization for small business isn’t a technical vanity project. It’s a direct revenue lever. A slow-loading page doesn’t just frustrate visitors — it actively drives them to your competitors. And here’s what most articles on this topic won’t tell you: the standard advice floating around online is recycled, oversimplified, and often targets the wrong problems entirely.
This guide cuts through that noise. We’re going to give you the honest, sequenced framework that professional web performance engineers actually use — not the checklist you’ve already read five times. Whether you’re running a WordPress site for your service business, a Shopify store, or anything in between, understanding why your site is slow — and in what order to fix it — is what separates wasted effort from real, measurable results.
The Business Case for Speed: Separating Fact from Recycled Myth
Before diving into diagnostics, it’s worth addressing the statistics you’ve probably already encountered. Yes, page speed affects bounce rates, conversions, and search rankings. But the specific numbers cited endlessly across the web — that famous 53% mobile abandonment figure, or the Amazon revenue-per-millisecond calculation — originated from enterprise-scale e-commerce environments with millions of visitors and radically different user expectations.
If your small business website receives 300 visits a month, those benchmarks don’t map directly onto your situation. That doesn’t mean speed is irrelevant — it absolutely matters. But it means the framing should be accurate.
Here’s what the evidence actually supports for small business websites:
- Bounce rate increases sharply between 1–3 second load times. Google’s own research shows that as page load time increases from 1 to 3 seconds, the probability of a visitor bouncing increases by 32%. From 1 to 5 seconds, that figure jumps to 90%. These are relative increases — but on a small business site where every lead counts, they’re meaningful.
- Core Web Vitals are a confirmed Google ranking signal, though not the dominant one. They form part of Google’s page experience signals. Passing the thresholds won’t rocket you to position one, but failing them can quietly suppress your organic visibility — particularly in competitive local searches where multiple sites are close in relevance.
- Perceived performance often outperforms raw load time for conversion behavior. We’ll come back to this — it’s one of the most underutilized insights in the industry.
The goal isn’t to hit an arbitrary score. The goal is a fast, responsive experience that keeps your target customers engaged long enough to contact you, book an appointment, or make a purchase.
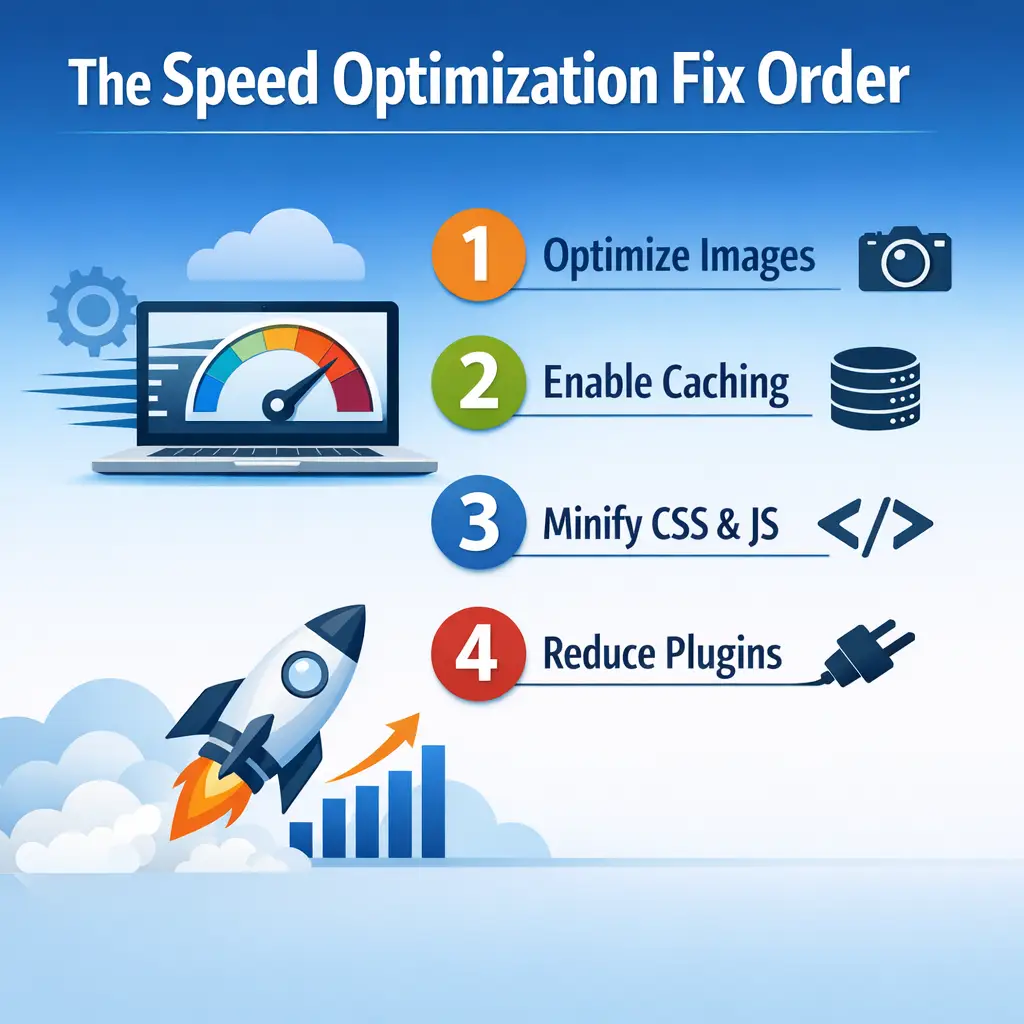
The Fix-Order Framework: Why Most Optimization Efforts Underdeliver
This is where most small businesses — and frankly, many agencies — go wrong. They jump straight to image compression and caching plugins without addressing the foundational issues that cap how far those optimizations can actually take you.
Professional web performance follows a clear hierarchy. Work down this list in order, and each step amplifies the one below it. Skip the top and the bottom produces diminishing returns.
Step 1: Fix Your Server Response Time (TTFB) First
Time to First Byte (TTFB) is the time it takes for your browser to receive the first byte of data from your server after making a request. It is the bedrock metric — and it is determined almost entirely by your hosting environment, not your plugins or image sizes.
If your TTFB is above 600ms, you are on the wrong hosting infrastructure for optimization to work properly. Full stop.
Entry-level shared hosting — where your site shares server resources with potentially hundreds of other websites — is the single most common reason small businesses spend money on optimization services and walk away disappointed. The ceiling is simply too low. No caching plugin, no CDN, no image optimizer can compensate for a server that takes 800ms just to respond.
What good looks like: A TTFB under 200ms is excellent. Under 400ms is acceptable. Above 600ms is a hosting problem that needs to be solved at the infrastructure level — typically by moving to a VPS (Virtual Private Server), managed WordPress hosting, or a cloud-based hosting provider with better resource allocation.
You can measure your TTFB using Google Search Console’s Core Web Vitals report or directly in Chrome DevTools under the Network tab.
Step 2: Address Render-Blocking Resources
Once your server is responding quickly, the browser’s job is to read your HTML and start building the page. Render-blocking resources — typically JavaScript and CSS files that load before the browser can render anything visible — are the next bottleneck.
Every time the browser encounters a script or stylesheet in the <head> of your HTML, it stops rendering and waits for that file to download and execute. For small business websites built on WordPress with multiple plugins, this can mean the browser is waiting on five, eight, or ten separate files before your visitor sees anything at all.
The practical fix: Defer non-critical JavaScript (load it after the main content), inline critical CSS (the styles needed for above-the-fold content), and load stylesheets asynchronously where possible. Quality WordPress performance plugins can handle much of this automatically, but the underlying principle matters — you need to understand why you’re configuring these settings, not just which button to click.
Step 3: Optimize Your Assets
This is where the advice you’ve already heard lives — and it’s valid advice, just not the starting point it’s often presented as.
Images are almost always the largest files on a small business website. The optimization standard has moved significantly. WebP format is now broadly supported and typically delivers 25–35% smaller file sizes than JPEG at equivalent visual quality. AVIF offers even further compression for browsers that support it. Serving correctly sized images (not a 1400px image scaled down to 400px in the browser) alone can dramatically reduce page weight.
Fonts are a frequently overlooked asset. Loading four weights of a web font from Google Fonts adds multiple network requests. Self-hosting your fonts, using font-display: swap, and loading only the weights you actually need are all meaningful wins.
Video embedded from external platforms (YouTube, Vimeo) adds third-party request overhead that we’ll address in the next section. Using facade patterns — a static thumbnail that loads the actual video player only when clicked — removes this overhead entirely until the user initiates playback.
Step 4: Implement Caching and Content Delivery
With your server, rendering pipeline, and assets in good shape, caching and CDN delivery become genuinely powerful amplifiers rather than band-aids on deeper problems.
Browser caching instructs returning visitors’ browsers to store static files locally, so subsequent page loads are dramatically faster — the browser doesn’t need to re-download assets it already has.
Server-side caching stores pre-built versions of your pages so the server doesn’t need to execute PHP and database queries every time someone visits. For WordPress sites with dynamic content, this is a significant performance improvement.
Content Delivery Networks (CDNs) distribute copies of your static assets across geographically distributed servers, so files are served from locations closer to your visitors. One important nuance competitors consistently miss: for a local service business — a landscaper, a dental practice, a law firm — whose entire customer base sits within a 30-to-50-mile radius, the geographic distribution benefit of a CDN is far smaller than the way it’s typically marketed. CDNs still provide value for asset delivery and DDoS protection, but if your audience is entirely local, this is a “nice to have” rather than a transformative fix.
The Third-Party Script Problem Nobody Is Talking About
Here is the conversation that is almost entirely absent from competitor content on this topic — and it may be the most relevant insight for a typical small business website.
Your website isn’t just running your code. It’s running code from every third-party service you’ve connected to it. And each of those services makes its own network requests to its own servers, completely outside your control.
A typical small business website in 2024 carries a payload that looks something like this:
| Script / Service | Purpose | Performance Impact |
|---|---|---|
| Google Analytics 4 | Traffic tracking | Low–Medium (async, but adds requests) |
| Meta Pixel | Ad retargeting | Medium (synchronous loading can block render) |
| TikTok / LinkedIn Pixel | Ad retargeting | Medium (same issues as Meta Pixel) |
| Live Chat Widget (e.g., Tidio) | Customer support | High (large scripts, external fonts, polling) |
| Booking Embed (e.g., Calendly) | Scheduling | Medium–High (iframe loads full external app) |
| Review Widget | Social proof | Medium (external API calls on page load) |
| Heatmap Tool (e.g., Microsoft Clarity) | UX analytics | Medium (session recording adds overhead) |
| Tag Manager Container | Script management | Low if clean, High if poorly managed |
Each row in that table represents an external network request made to a server you don’t own, on an infrastructure you can’t optimize, from a team that has no incentive to prioritize your page’s performance.
The compounding effect is significant. A single slow third-party server can delay your entire page’s rendering, regardless of how well-optimized your own code and assets are. This is one of the primary reasons a site can score excellently on local tests but perform poorly for real users — the third-party servers are performing differently on different days, at different times, from different locations.
How to Conduct a Third-Party Script Audit
The diagnostic tool you want here is WebPageTest, specifically its waterfall view. This shows you every single network request your page makes, in the sequence it makes them, with timing data for each. Third-party scripts show up as requests to external domains — you can see exactly how long each one takes and whether any are blocking the critical rendering path.
Once you’ve identified your third-party scripts, apply this decision framework to each one:
- Is this script actively being used? Many small business sites carry pixels and scripts from tools that were set up and forgotten. Unused scripts are pure performance cost with zero business value — remove them immediately.
- Can it be deferred? Scripts that don’t need to execute on initial page load (heatmaps, chat widgets, non-essential trackers) can be loaded after the main page content renders, preserving the critical path.
- Can it be self-hosted? Some scripts — Google Fonts being the most common example — can be downloaded and served from your own server, eliminating the external request entirely.
- Does its business value justify its performance cost? This is the honest question few people ask. If your live chat widget is adding 1.2 seconds to your load time but generating two booked appointments per month, that’s a defensible trade-off. If it’s generating zero conversions, it’s an expensive ornament.
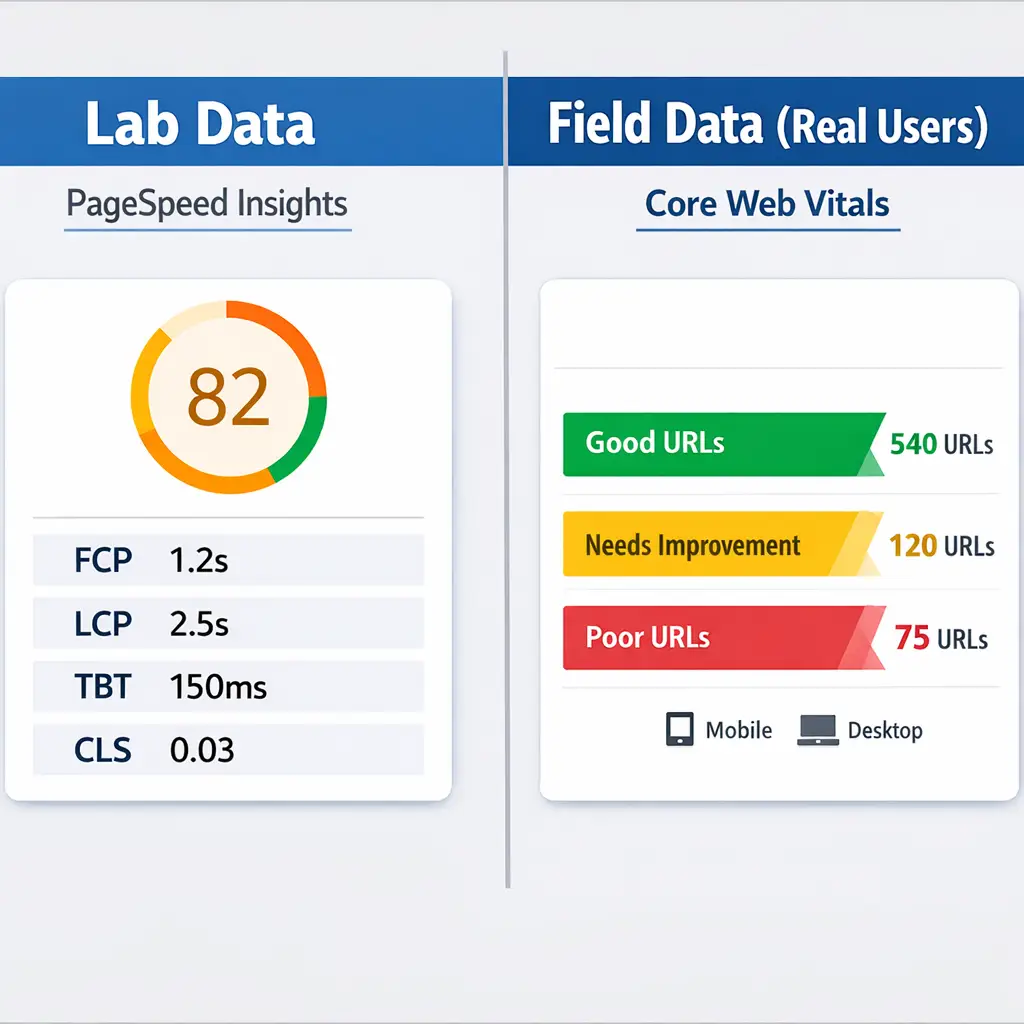
Lab Data vs. Real User Data: Optimizing for the Right Metric
This distinction is one of the most consistently misunderstood aspects of website speed optimization for small business — and it directly affects whether your efforts translate into actual SEO benefit.
When you run your site through PageSpeed Insights and get a score, you are looking at lab data: a simulated test run from Google’s servers, on a standardized device, under controlled network conditions. It is useful for diagnostics. It is not what Google uses to evaluate your site for ranking purposes.
Google’s ranking algorithm uses field data — specifically, the Chrome User Experience Report (CrUX), which aggregates real performance data from actual Chrome users visiting your site. This is called Real User Monitoring (RUM) data, and it reflects the messy reality of your actual visitors: different devices, different connection speeds, different geographic locations, different browser states.
The implications are significant:
- A site can score 90 in PageSpeed Insights lab tests but have a “Poor” Core Web Vitals designation in Google Search Console if real users are experiencing slow loads. The opposite is also occasionally true.
- If your site doesn’t have enough traffic to generate sufficient CrUX data, Google will fall back to lab-based assessments for ranking purposes — which changes the priority of certain optimizations.
- Optimizing purely to improve your PageSpeed score without checking your Core Web Vitals status in Google Search Console is optimizing for the wrong output.
The right workflow: Use PageSpeed Insights to identify what to fix. Use Google Search Console’s Core Web Vitals report to track whether those fixes are improving real user experience. These are two different tools solving two different parts of the same problem.
Perceived Performance: The Half of the Equation Most Businesses Ignore
Here’s an insight that separates practitioners who understand user psychology from those who only understand technical metrics: how fast your site feels is not the same as how fast your site is.
Perceived performance refers to the user’s subjective experience of speed — and it is highly responsive to specific design and loading patterns that don’t change your actual load time at all.
Consider two scenarios. In the first, a page takes 3 seconds to load but shows nothing until it’s fully ready — a blank white screen followed by a complete page. In the second, the same page takes 3 seconds to fully load but shows the page layout and a content skeleton immediately, with real content filling in progressively as it loads. The second page feels dramatically faster, even though the total load time is identical. Users perceive progress as performance.
The techniques that produce this effect include:
- Skeleton screens: Placeholder layouts that match the structure of incoming content, loading in milliseconds, giving users the visual impression of immediate response.
- Above-the-fold prioritization: Ensuring that the content visible in the viewport on initial load — your headline, primary image, call-to-action — loads and renders as quickly as technically possible, even if below-fold content loads slightly later.
- Progressive rendering: Structuring your HTML so the browser can paint visible content early and continue loading less-critical elements in the background.
- Optimistic UI patterns: On interactive elements like form submissions or button clicks, immediately showing a visual response (a loading indicator, a state change) rather than waiting for server confirmation before providing any feedback.
For small business websites where conversion actions — calling, booking, submitting a form — happen above the fold, prioritizing perceived performance in the critical path can meaningfully improve conversion rates without requiring infrastructure changes. This is a genuine competitive edge that purely technical optimization approaches miss entirely. For a deeper look at how these principles connect to turning visitors into customers, the article on conversion optimization: beyond the basic CRO playbook covers the broader strategy in detail.
Core Web Vitals: What They Actually Measure (And What’s Changed)
A factual note that is worth stating plainly: as of March 2024, Google officially replaced First Input Delay (FID) with Interaction to Next Paint (INP) as the third Core Web Vital. Multiple articles currently ranking on this topic still reference FID as a current metric — it is not. If you’ve encountered that in your research, you’re reading outdated content.
Here’s a current, accurate breakdown of what Core Web Vitals measure and what actually drives each one:
| Metric | What It Measures | “Good” Threshold | Primary Causes of Failure |
|---|---|---|---|
| LCP (Largest Contentful Paint) | Time until the largest visible content element loads | Under 2.5 seconds | Slow server (TTFB), unoptimized hero images, render-blocking resources |
| INP (Interaction to Next Paint) | Responsiveness to user interactions throughout page life | Under 200ms | Heavy JavaScript execution, third-party scripts, long tasks blocking the main thread |
| CLS (Cumulative Layout Shift) | Visual stability — how much content shifts unexpectedly during load | Under 0.1 | Images without dimensions, late-loading ads, dynamically injected content |
The non-linear relationship between score improvement and business impact is worth understanding here. Moving a site from a Core Web Vitals score of 45 to 75 typically involves fixing the most egregious bottlenecks — bad hosting, uncompressed images, render-blocking scripts — and produces the most noticeable user experience and ranking improvements. The effort required to move from 75 to 95 is often exponentially higher, involves diminishing UX returns, and may require architectural changes that aren’t practical for a small business. Know where your most productive optimization window is, and don’t burn resources chasing a perfect score when the meaningful gains have already been captured.
Platform-Specific Realities: The Advice That Applies to Your Site
Almost every piece of content on this topic treats all websites as functionally identical. They are not. The optimization strategy for your site depends heavily on the platform it’s built on.
WordPress (self-hosted): The most complex optimization environment, with the widest range of control and the most ways things can go wrong. Hosting choice is critical. Caching plugins, image optimization plugins, and performance-focused themes all play meaningful roles. Third-party script management via a tag manager is strongly advisable. The fix-order framework described above applies directly and in full. If you’re evaluating whether WordPress is the right platform for your business in the first place, the article on WordPress web design for small businesses that works is worth reading before making any infrastructure decisions.
Shopify: Shopify handles CDN delivery and certain performance infrastructure at the platform level — it is managed for you. This means a significant portion of plugin-based advice you’ll read for WordPress is simply irrelevant on Shopify. The primary optimization levers available to Shopify store owners are theme selection and code quality, image optimization, app audit (Shopify apps are functionally equivalent to WordPress plugins in their performance impact), and third-party script management through the Shopify checkout and theme customizer.
Squarespace / Wix / Weebly: Hosted website builders manage server infrastructure, CDN, and core performance on your behalf. Optimization options are limited to content decisions: image compression before upload, limiting embedded third-party scripts, and keeping page layouts clean. If performance is a priority, the platform itself may be the ceiling.
Custom-built applications: The full toolkit applies, with optimization work happening at the code level rather than through plugin interfaces. Performance decisions are made in the development process and require technical developer involvement to revisit.
Understanding which category your site falls into focuses your effort and budget where it can actually move the needle — rather than implementing advice designed for a different platform.
Speed Erosion: The Problem Nobody Discusses
One of the largest gaps in standard speed optimization content is the complete absence of any discussion about what happens after you optimize.
Speed gains are not permanent by default. Every new plugin installation, every platform update, every new marketing tool you add to your site introduces the potential for performance regression. A site that passed Core Web Vitals in January may be failing by August, not because anything broke — but because three new tools were added, a plugin conflict emerged, and a new page template introduced unoptimized images.
Professional performance management treats speed as an ongoing metric, not a one-time project. The practical minimum for a small business is:
- Monthly monitoring of Core Web Vitals in Google Search Console, with alerts configured for any significant degradation in the “Good” URL count.
- Quarterly third-party script audits, reviewing whether every script still serves an active business purpose.
- Pre-launch performance checks before any significant site update, new plugin installation, or new marketing tool integration — not after.
- Annual hosting review, particularly if your business has grown and your traffic volume has increased meaningfully since your hosting plan was last evaluated.
Speed optimization is not a box to check. It’s a standard to maintain — and maintaining it proactively is far less disruptive than diagnosing a performance problem after it’s already affecting your search visibility and conversion rates. If you want to understand how site performance connects to the broader set of technical issues suppressing your rankings, the technical SEO audit for small business article walks through the full diagnostic process.
Strategic Recommendations for 2026
The landscape of website performance is shifting, and small businesses that act on the right priorities now will be better positioned as Google continues to weight page experience signals more heavily in rankings. Three specific moves worth prioritizing in the year ahead:
1. Adopt Real User Monitoring (RUM) Through Google Search Console’s Core Web Vitals Report
Lab data from tools like PageSpeed Insights gives you a snapshot. Real User Monitoring gives you actual field data from visitors on your site. Google Search Console’s Core Web Vitals report is free, integrates directly with how Google evaluates your site, and surfaces problems tied to specific URL groups — not just a homepage average. If you are not reviewing this report monthly, you are operating without the most relevant performance signal available to you.
2. Migrate to a Dedicated WordPress Hosting Environment if You Haven’t Already
Shared hosting continues to be the single most common source of preventable performance failure for small business websites. Purpose-built managed WordPress hosts have invested heavily in server-level caching, PHP optimization, and CDN integration that generic shared hosting simply does not replicate. The performance gap between the two environments has widened considerably, and the migration process is typically less disruptive than most small business owners expect.
3. Conduct a Third-Party Script Inventory Before Adding Anything New in 2026
Before installing the next analytics tag, chat widget, or retargeting pixel, audit what is already loading on your site. Tools like Request Map Generator and Google Tag Manager’s built-in tag overview give you a clear picture of your current script load. A one-hour audit of existing scripts frequently reveals two or three tools that are no longer active business priorities but are still adding load time on every page visit. Remove before you add.
Frequently Asked Questions
How long does it take to see results after optimizing website speed?
Core Web Vitals improvements typically begin appearing in Google Search Console within four to six weeks of implementation, as Google needs time to recrawl your pages and accumulate new field data from real users. Conversion and bounce rate improvements are often visible more quickly in your analytics — sometimes within days of resolving significant performance bottlenecks — because visitors experience the faster site immediately. The timeline varies depending on how much your traffic volume feeds into Google’s field data collection.
Do I need a developer to improve my website’s speed, or can I do it myself?
It depends on your platform and the specific issues identified. Many WordPress sites running managed hosting can achieve meaningful gains through plugin-based caching and image optimization tools without developer involvement. However, render-blocking resource issues, custom code bloat, server configuration changes, and complex third-party script management typically require technical expertise to resolve correctly. Attempting advanced performance changes without that expertise can introduce new problems that are harder to diagnose than the original issue.
Will switching to a faster host automatically fix my Core Web Vitals scores?
Hosting is one of the most impactful variables, particularly for Time to First Byte (TTFB), but it is rarely the only factor. A site with unoptimized images, excessive third-party scripts, or render-blocking resources will still have poor Largest Contentful Paint and Interaction to Next Paint scores even on excellent hosting infrastructure. Hosting improvements set the foundation — but they work best when combined with front-end optimization work addressing how the page itself is built and loaded.
How often should a small business check their website speed?
At minimum, Core Web Vitals should be reviewed monthly in Google Search Console, with a closer look any time a new plugin, tool, or integration is added to the site. Quarterly third-party script audits help prevent gradual performance erosion from accumulated marketing and analytics tags. The goal is to catch regressions before they affect search visibility or conversion rates — not after a ranking drop prompts an emergency review.
Conclusion
Website speed optimization is one of those disciplines where the gap between knowing what to do and knowing how to do it correctly on your specific site is significant — and that gap has real consequences for your search rankings and the customers trying to reach you. Mongoose Digital Marketing works with small businesses on exactly this kind of work, combining technical SEO services and website design that is built for performance from the ground up, not patched for it afterward. If your site has been feeling slower than it should, or you have never had a proper performance audit, Contact Mongoose Digital Marketing and we will take a look.