
The Uncomfortable Truth About Conversion Optimization
Most businesses treating conversion optimization as a checklist activity are generating data, not insight. They’re running tests, watching dashboards, and declaring winners — while the actual drivers of customer acquisition quality go completely unexamined.
That’s not a criticism of the businesses. It’s a criticism of the prevailing advice. The standard CRO playbook — test your CTAs, add social proof, reduce form fields, improve page speed — isn’t wrong. It’s just operating at a level of depth that produces marginal, short-lived gains rather than structural improvements in how your website turns visitors into valuable customers.
This guide covers what rigorous conversion optimization actually looks like: the methodological realities that most content omits, the measurement traps that inflate vanity metrics while eroding real business outcomes, and the strategic framework that separates programs producing compounding growth from programs that are tactically busy but commercially stalled.
What Conversion Optimization Actually Measures (And What It Doesn’t)
Before addressing tactics, it’s worth being precise about what conversion rate is — and isn’t.
The standard definition holds: conversion rate equals the number of completed goal actions divided by total visitors, expressed as a percentage. Simple enough. The problem is how that metric gets used in practice.
Conversion rate is an output metric. It tells you the result of everything upstream — your traffic quality, your messaging alignment, your user experience, your offer clarity, and your page architecture. When you treat it as a direct lever to pull, you start making changes to the output column of your spreadsheet while leaving the input columns untouched.
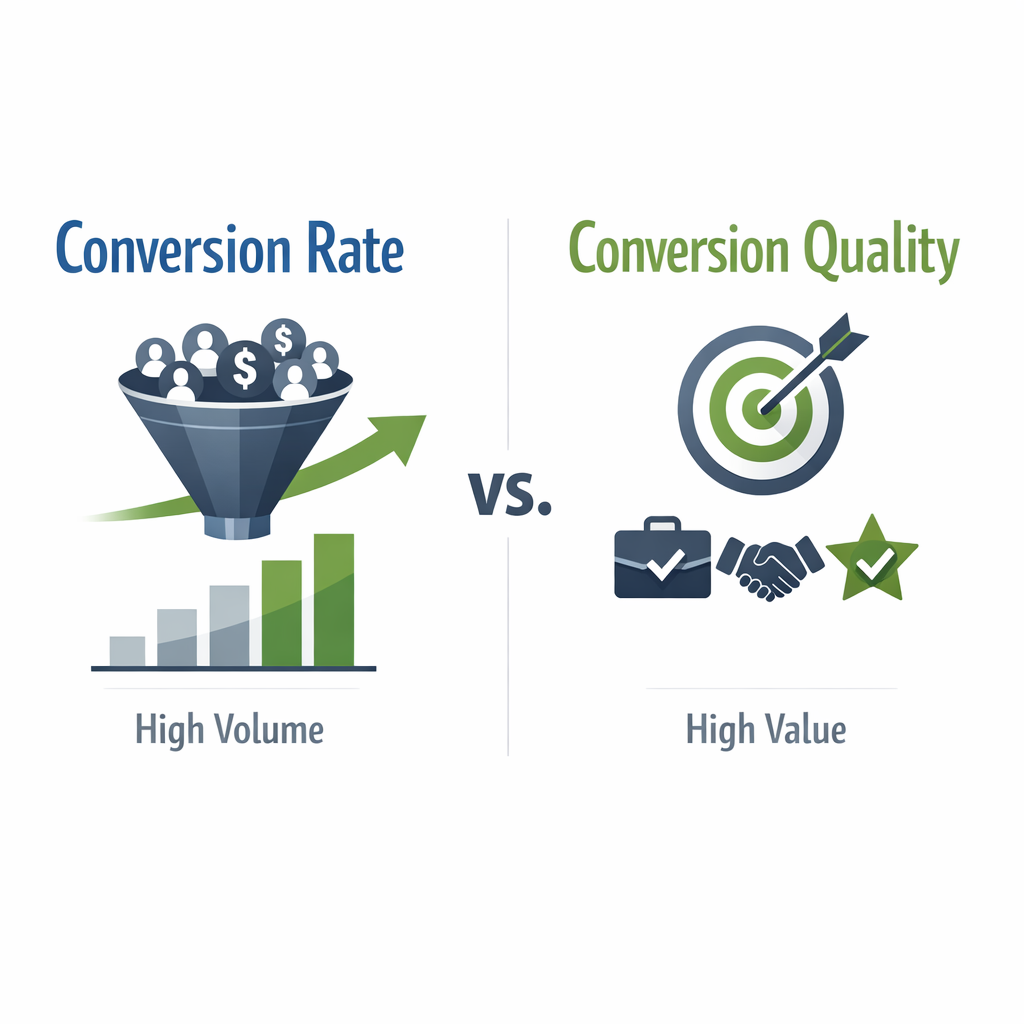
This produces a specific failure mode that almost no CRO content addresses honestly: you can improve your aggregate conversion rate while simultaneously degrading the quality of customers you’re acquiring.
Here’s the mechanism. Reducing friction universally — simplifying forms, removing confirmation steps, streamlining checkout — also removes the natural qualification filter embedded in that friction. A customer who fills out a detailed intake form has demonstrated intent. A customer who clicked through a one-tap CTA has demonstrated interest. These are not equivalent, and treating the second cohort as a success because they converted is a measurement error, not a marketing win.
Sophisticated conversion optimization programs track what happens after the conversion: average order value by acquisition source, customer retention rates across test variant cohorts, support ticket volume from customers acquired through different page versions. These are the metrics that tell you whether your CRO program is building a better business or just a better-looking funnel.
The Statistical Reality of A/B Testing Most Programs Ignore
A/B testing is the central methodology of conversion optimization. It is also one of the most systematically misapplied tools in digital marketing — not because the concept is flawed, but because the conditions required for valid results are almost never present at the businesses running the tests.
Why Most A/B Tests Produce Meaningless Results
The conversation around A/B testing almost universally focuses on statistical significance — reaching the 95% confidence threshold that a result is not due to chance. What it almost never addresses is statistical power, which is an entirely different and equally important concept.
Statistical power (denoted as 1-β) is the probability that your test will detect a real effect if one exists. A test with low statistical power is like trying to hear a quiet conversation across a noisy room — even if the signal is there, you won’t reliably pick it up. Industry standard is to design tests with 80% power minimum, meaning an 80% chance of detecting a true difference.
Power is determined by three variables:
- Your baseline conversion rate — the lower it is, the more traffic you need
- Your minimum detectable effect (MDE) — the smallest improvement you’re trying to detect
- Your daily traffic volume to that specific page
This is where the practical problem emerges. If your landing page converts at 2.5% and you want to detect a realistic 5% relative improvement (moving from 2.5% to 2.625%), you need tens of thousands of visitors per variant to reach an adequately powered test. Most business websites operating below several thousand monthly visitors to a specific page will never accumulate that volume before business conditions — seasonality, offer changes, market shifts — render the test environment invalid.
The result: businesses run underpowered tests, reach 95% statistical significance on a sample that was never capable of detecting the improvement they were actually looking for, and implement changes based on noise they’ve mistaken for signal.
The Minimum Detectable Effect Audit
Before launching any A/B test, a well-run CRO program calculates the MDE for that test given available traffic. If the MDE required to reach a powered test within a reasonable timeframe is larger than any realistic improvement — say, the math requires detecting a 60% relative lift to be valid, but you’re hoping for 10% — then A/B testing is the wrong tool for that page at that traffic level.
The practical implication is direct: for most business websites, qualitative research and expert heuristic analysis will produce more reliable conversion improvements than A/B testing, because they don’t require statistical validity thresholds that the available traffic can’t support. Testing should be reserved for validation of hypotheses already generated through research, not as the primary discovery method.
The Traffic Quality Problem: Optimizing the Wrong Visitors
There’s a structural issue in conversion optimization that almost nobody discusses in broad-audience content: you cannot optimize your way out of a traffic quality problem.
If the visitors arriving at your conversion page are low-intent — they’re researching, price-comparing, or arrived via a broad keyword that captures the wrong audience — then optimizing that page to convert more of them produces a deceptive result. Your conversion rate goes up. Your revenue per customer cohort goes down. Your sales team closes fewer deals because lead quality has degraded. Your retention numbers weaken.
This is not hypothetical. It’s the predictable outcome of CRO programs that operate in isolation from acquisition strategy. For a deeper look at how traffic intent shapes pipeline outcomes, the article SEO for Lead Generation 2026: What Actually Drives Pipeline covers the acquisition side of this equation in detail.
The correct framework treats conversion optimization as acquisition-aware. Before building a testing roadmap for any page, the foundational questions are:
- What is the intent distribution of traffic arriving at this page? (High-intent branded search vs. broad informational traffic vs. paid retargeting audiences all require different conversion architectures)
- Is the conversion rate problem actually a traffic quality problem in disguise?
- Are there segments within current traffic that convert well, and segments that don’t? What distinguishes them?
Answering these questions before touching page elements is the difference between a CRO program that compounds results over time and one that chases its own tail.
Conversion Optimization Methodology: Research-First, Test-Second
The most common structural flaw in CRO programs is treating testing as the primary activity. Testing is a validation mechanism. The primary activity is research — understanding why visitors are not converting before hypothesizing how to fix it.
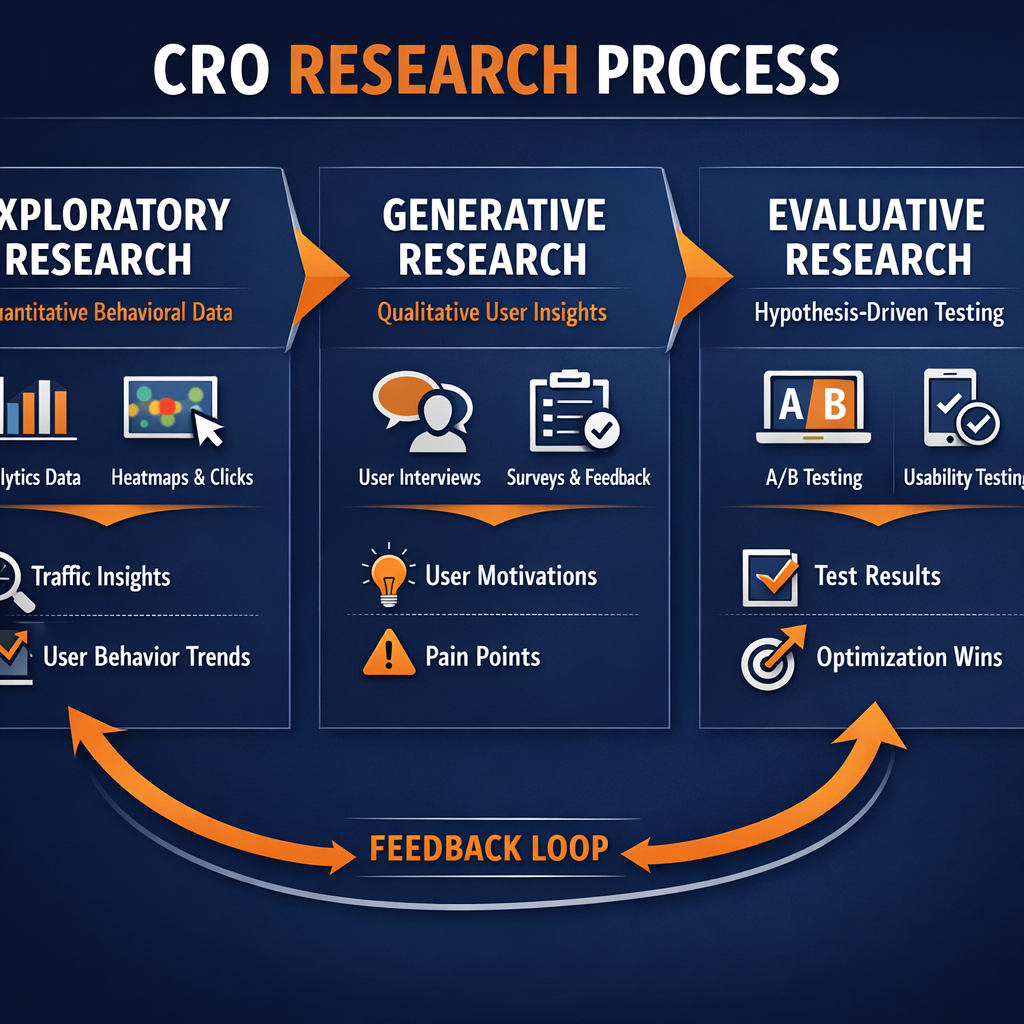
The Three Layers of Pre-Test Research
Exploratory Research identifies what to focus on. This layer uses quantitative behavioral data — heatmaps, scroll depth, click maps, funnel drop-off analysis, session recordings — to locate where in the experience visitors are abandoning or stalling. The output is a prioritized list of problem areas, not solutions.
Generative Research identifies why those problems exist. This layer uses qualitative methods — user interviews, on-site surveys, customer feedback analysis, sales call recordings — to understand the cognitive and emotional friction behind the behavioral signals. A heatmap shows you that visitors aren’t scrolling past your hero section. Generative research tells you why: the headline doesn’t match what they came looking for, the value proposition is ambiguous, or the visual hierarchy pulls attention away from the primary message.
Evaluative Research validates specific solutions. This is where A/B testing lives — testing a specific hypothesis generated by the first two layers against a defined success metric. Testing at this stage is focused, powered correctly for the traffic available, and connected to a specific insight rather than a generic “let’s try a different button color” impulse.
Most programs skip directly to evaluative research and wonder why their testing roadmap feels tactically busy but strategically shallow.
The Cognitive Architecture of Conversion: Beyond “Add Social Proof”
The psychological dimension of conversion optimization gets treated superficially in most content. “Add testimonials,” “create urgency,” “make the CTA button bigger” — these are surface-level applications of behavioral science that don’t engage with the actual mechanisms driving conversion decisions.
Understanding those mechanisms produces more durable improvements than chasing tactical optimizations.
System 1 vs. System 2 Decision Architecture
Visitors to any conversion page are operating in one of two cognitive modes (drawn from the well-established dual-process model of human cognition):
System 1 is fast, automatic, and emotionally driven. It processes visual hierarchy, emotional resonance, brand familiarity, and pattern recognition. It makes snap judgments about trustworthiness, relevance, and whether the page “feels right” before any deliberate evaluation occurs.
System 2 is slow, deliberate, and analytical. It evaluates specific claims, compares features, processes pricing logic, and weighs risk against benefit. It activates when System 1 doesn’t immediately resolve the decision — typically when stakes are higher, offers are complex, or uncertainty is present.
Most CRO advice accidentally optimizes exclusively for System 2 — clearer feature lists, more detailed specs, better comparison tables — while leaving System 1 experience unaddressed. But System 1 is the gatekeeper. If the page triggers a negative emotional or intuitive response in the first 3–5 seconds, System 2 never engages with the content you’ve carefully optimized.
High-performing conversion pages are designed to pass the System 1 threshold (visual clarity, immediate relevance signal, emotional safety) before engineering the System 2 persuasion architecture.
Loss Aversion vs. Gain Framing
Decades of behavioral economics research consistently demonstrates that people are more motivated by avoiding a loss than acquiring an equivalent gain. In conversion contexts, this means framing choices around what a visitor risks missing out on or continuing to lose is structurally more compelling than framing around what they’ll gain.
The application isn’t “add countdown timers and fake scarcity” — that approach degrades trust and generates short-term conversion spikes at the cost of long-term brand damage. The legitimate application is accurate loss framing: communicating the real cost of inaction in terms your audience connects with, whether that’s time, competitive disadvantage, revenue left on the table, or problems that compound without resolution.
Decision Fatigue Architecture
The number of decisions a visitor must make on the path to conversion directly affects completion rates — this is well-established. Where most CRO advice stops is at “reduce form fields.” The more sophisticated application is decision sequencing: structuring the conversion path so that micro-commitments build progressively, and the most cognitively demanding decisions (commitment level, contact information, payment) come after the visitor has already made several smaller ones that prime continued engagement.
This is distinct from dark patterns. It’s sound conversion architecture that respects the natural rhythm of human decision-making.
Common CRO Metrics: What Each Tells You and What It Doesn’t
The following comparison covers the primary metrics used in conversion optimization programs, the information each provides, and the limitations practitioners need to account for when drawing conclusions.
| Metric | What It Measures | Useful For | Blind Spots |
|---|---|---|---|
| Aggregate Conversion Rate | Percentage of all visitors completing a goal | Directional performance benchmarking | Masks segment-level divergence; affected by traffic mix changes |
| Segmented Conversion Rate | Conversion rate by traffic source, device, geography, audience | Identifying where experience breaks down | Requires sufficient segment volume to avoid underpowered analysis |
| Micro-Conversion Rate | Completion of intermediate steps (video views, scroll depth, tool interaction) | Diagnosing funnel stage failures before main conversion | Can be optimized in isolation without improving primary conversion |
| Time to Conversion | Duration from first visit to completed conversion | Understanding consideration cycle length | Varies significantly by traffic temperature; aggregate average misleads |
| Revenue Per Visitor (RPV) | Average revenue generated per site visitor | Connects conversion activity to financial outcome | Requires e-commerce or trackable revenue attribution |
| Customer Lifetime Value by Variant | LTV of customers acquired through different page versions | Evaluating conversion quality, not just volume | Requires extended measurement window; rarely tracked in standard CRO programs |
| Form Abandonment Rate | Percentage of users who start but don’t complete a form | Identifying friction in lead capture | Doesn’t distinguish intent drop-off from friction drop-off |
| Bounce Rate by Segment | Single-page session rate filtered by traffic source | Diagnosing traffic-page relevance misalignment | Inflated by single-page site designs; misinterpreted without context |
| Statistical Power of Tests | Probability test can detect a real effect at current traffic | Determining whether testing is a valid methodology for a given page | Almost never reported in standard CRO platform dashboards |
| Test Novelty Period Performance | Conversion behavior in first 1–2 weeks of a variant | Identifying novelty bias in early results | Often mistaken for genuine improvement if test is called too early |
The Iterative Optimization Trap: When Local Maxima Masquerade as Progress
There’s a well-documented phenomenon in mature CRO programs that almost no introductory content addresses: iterative optimization tends toward local maxima.
Here’s how it unfolds. A program begins testing systematically. Early wins are real — the baseline page has obvious inefficiencies, and structured testing surfaces genuine improvements. Over 12–18 months, the team accumulates a series of winning variants. Each change is implemented. Each test informs the next.
The problem is that each successive test is influenced by the accumulated changes of every previous winning variant. After enough iterations, the page has moved substantially from its original state. The reference context within which early test winners performed is gone. Elements that won in isolation are now interacting with other previously-winning elements in ways that were never tested.
This creates two specific risks:
Interaction effects go undetected. A headline variant that won against the original headline may perform differently when combined with the CTA variant that also won against the original CTA. Sequential single-variable testing assumes independence between page elements that are psychologically interdependent for the visitor.
The optimized page gets trapped. The current “best” version of the page may be meaningfully inferior to a fresh redesign that doesn’t carry the accumulated assumptions of 20 sequential tests. But because each individual comparison showed an improvement, the team has no mechanism for detecting that they’ve optimized into a corner.
High-maturity CRO programs account for this by periodically running reset tests — comparing the fully-optimized current page against a fundamentally different redesign approach. These tests are designed not to validate incremental improvements but to check whether the iterative process has produced genuine progress or local maxima trapping.
It’s a harder case to make internally — “let’s test whether all our work was actually productive” isn’t a comfortable conversation. But programs willing to run that test consistently outperform programs that don’t over multi-year horizons.
Building a CRO Program That Produces Compounding Results
The difference between conversion optimization as a tactic and as a strategic capability comes down to program architecture. Here’s what that distinction looks like in practice:
Tactical CRO (Where Most Programs Operate)
- Tests generated from intuition or copied from industry “best practice” lists
- Success measured by individual test wins and aggregate conversion rate trends
- Research treated as optional or performed reactively when tests fail
- No traffic quality filter on which pages to prioritize
- Statistical validity not formally evaluated before tests launch
- No measurement of post-conversion customer quality
Strategic CRO (Where Compounding Growth Happens)
- Testing roadmap generated from structured exploratory and generative research
- Success measured by revenue per visitor, customer LTV by variant, and segment-level performance
- Research is the primary activity; testing is the validation mechanism
- Traffic quality assessed before any page optimization begins
- Test designs evaluated for statistical power at available traffic volumes before launch
- Cohort behavior of acquired customers tracked across variant implementations
- Periodic reset tests prevent local maxima accumulation
- Bayesian testing frameworks used where practical to enable faster, more nuanced decision-making than binary significance thresholds allow
The output of a tactical program is a better-performing page. The output of a strategic program is a better-performing business — because it’s optimizing for customer quality and commercial outcome, not just the dashboard metric.
Where Conversion Optimization Fits in a Full-Funnel Growth Strategy
Conversion optimization doesn’t operate in a vacuum. Its leverage is directly proportional to the quality and volume of traffic flowing into the experience being optimized.
This is why the most effective CRO outcomes happen when the program is connected to the full acquisition picture. SEO brings high-intent organic visitors whose search query already signals what they’re looking for — a well-aligned landing page for that intent can convert at multiples of the same page shown to cold traffic. Paid search audiences carry commercial intent that the ad messaging has already primed. Retargeting audiences have demonstrated prior interest, making the conversion architecture requirements fundamentally different from first-touch pages.
Each of these traffic types requires a different conversion strategy. A single “optimized” page deployed across all of them is a compromise that serves none of them well. The more precisely conversion architecture is matched to traffic intent and acquisition stage, the more the underlying math of visitor-to-customer improves — not because you found a better button color, but because the experience is precisely calibrated to the psychological state of the person arriving.
That kind of precision is what separates conversion optimization as a discipline from conversion optimization as a marketing buzzword. If you’re evaluating how your current digital marketing investment is performing across the full funnel, our services cover the integrated approach that makes this kind of precision possible.
Strategic Recommendations for 2026
The discipline is maturing fast. The programs that will outperform in 2026 are those that build infrastructure today rather than react to capability shifts later. Three specific areas deserve prioritized attention:
1. Invest in a Behavioral Intelligence Layer
Move beyond pageview and click data. Platforms like Microsoft Clarity, FullStory, or Heap provide session-level behavioral data — rage clicks, scroll depth, dead clicks, form abandonment points — that transforms hypothesis generation from guesswork into evidence-based targeting. In 2026, teams without a behavioral data foundation will be testing the wrong things faster, which is not an advantage. Instrument your key conversion flows now, build a baseline, and let the behavioral signal guide test prioritization rather than stakeholder opinion.
2. Adopt a Structured Experimentation Platform
Spreadsheet-tracked A/B tests and manually stitched analytics are a ceiling, not a system. Platforms such as Optimizely, VWO, or Convert provide the statistical rigor, traffic allocation controls, and test history documentation that a strategic program requires. Critically, they also prevent the knowledge decay that kills most CRO programs — when the person who ran the test leaves, the institutional learning leaves with them. A proper experimentation platform keeps that knowledge inside the organization, compounding over time.
3. Connect CRO Directly to Your CRM and Revenue Data
The most important upgrade available to a conversion program in 2026 is closing the loop between front-end experiment outcomes and back-end customer value. Integrating your testing platform with your CRM — whether that’s Salesforce, HubSpot, or a custom stack — means you can evaluate variants not just on conversion rate but on lead quality, close rate, and downstream retention. This is the infrastructure that separates programs optimizing for form fills from programs optimizing for revenue.
Frequently Asked Questions
What is conversion optimization and why does it matter?
Conversion optimization is the systematic practice of improving the percentage of website visitors who complete a desired action — whether that’s submitting a form, making a purchase, or booking a call. It matters because it multiplies the return on every traffic source already feeding your site. Rather than spending more to acquire more visitors, conversion optimization extracts more value from the visitors already arriving, improving the underlying unit economics of your entire growth model.
How is conversion rate optimization different from just redesigning a website?
A website redesign is typically driven by brand preference, aesthetic judgment, or technology refresh cycles. Conversion rate optimization is driven by behavioral data, structured hypotheses, and controlled experiments. CRO changes specific elements — headlines, calls to action, page structure, form fields — based on evidence of where visitors are dropping off and why. A redesign replaces the whole system at once with no controlled measurement. CRO improves the system incrementally with documented, reproducible results.
How much traffic do you need before A/B testing is worthwhile?
Traditional frequentist A/B testing requires sufficient traffic to reach statistical significance within a reasonable timeframe — generally, the lower your current conversion rate and the smaller the expected lift, the more traffic you need. Sites with lower traffic volumes are not excluded from optimization, however. Bayesian testing frameworks, qualitative research methods, user session analysis, and expert heuristic audits can all produce actionable improvements without requiring large sample sizes. The methodology should be matched to the traffic reality of the program.
What metrics should conversion optimization actually be measured against?
Conversion rate is the obvious primary metric, but it should never be evaluated in isolation. A variant that increases form submissions while decreasing lead quality is not a win — it’s a measurement problem. Effective CRO programs track a hierarchy of metrics: the primary conversion event, a downstream quality indicator such as close rate or qualified lead percentage, and a guardrail metric that flags unintended negative effects like increased bounce rate or reduced engagement depth. Revenue per visitor and customer lifetime value, where measurable, are the most strategically honest metrics a program can optimize toward.
How does conversion optimization interact with SEO?
SEO and conversion optimization are mutually reinforcing when coordinated deliberately. SEO determines what intent-bearing visitors arrive and what expectations they carry based on the query that brought them. CRO determines whether the experience those visitors land in fulfills that intent clearly enough to produce action. A page that ranks well but converts poorly is leaving compounded value on the table. Aligning the semantic intent of ranking keywords with the conversion architecture of the destination page is one of the highest-leverage optimizations available — it improves conversion without changing traffic, and it often improves engagement signals that support continued ranking. The article What Local SEO Companies Won’t Tell You covers related dynamics around how SEO strategy affects the quality of traffic you’re ultimately trying to convert.
How long does it take to see results from a conversion optimization program?
Initial diagnostic findings — from heuristic audits, session recordings, and analytics analysis — are typically available within the first few weeks of a program. Tested and validated improvements take longer, because experiments must run for sufficient duration to produce reliable results. Early wins from high-confidence changes can appear within the first one to two months. Compounding program gains — where each validated learning informs the next layer of testing — generally become measurable over a three-to-six month horizon. Programs with lower traffic volumes should expect longer timelines to statistical confidence.
Conclusion
Conversion optimization, practiced at the level this article has outlined, is one of the few growth disciplines that improves returns on everything else a business is already doing. It doesn’t replace strong positioning, quality traffic acquisition, or a compelling product — it amplifies all of them by ensuring that the experience between arrival and decision is as precisely calibrated as the effort that brought visitors there in the first place.
The programs that will define competitive performance in 2026 and beyond are being built now — with the right data infrastructure, the right testing discipline, and the strategic clarity to optimize for customer quality rather than vanity metrics. If your organization is ready to build that kind of program, Contact Us to start the conversation.