
What Conversion Rate Optimisation Actually Is (And Why Most Businesses Are Doing It Wrong)
Most businesses approach conversion rate optimisation the same way they approach a leaky tap — fix the obvious drip and move on. A button colour change here, a headline tweak there, maybe a trust badge added to the checkout page. Then they wait for the numbers to move and wonder why they don’t.
The problem isn’t effort. It’s the mental model.
Conversion rate optimisation is not a collection of on-page fixes. It is a systematic discipline that spans research methodology, statistical science, user psychology, and business strategy. When it works at the highest level, it compounds — each insight sharpens the next hypothesis, and each validated win builds a clearer picture of why your visitors behave the way they do. When it’s done badly, which is most of the time, it produces a backlog of inconclusive tests, false positives that don’t hold at scale, and a rising conversion rate metric that is quietly masking deteriorating business outcomes.
This guide covers what competitors in this space consistently skip: the structural thinking, the pre-test research stack, and the statistical literacy that separates CRO programmes that generate sustained revenue growth from those that generate noise.
The Definition That Actually Matters
The standard definition you’ll find everywhere is straightforward enough: conversion rate is the percentage of visitors who complete a desired action, calculated by dividing total conversions by total visitors and multiplying by 100.
That formula is not wrong. It’s just incomplete as a basis for decision-making.
Here’s the problem. Conversion rate is a ratio, and ratios respond to changes in both the numerator and the denominator. If you cut a poorly-performing paid campaign and retain only high-intent organic visitors, your conversion rate rises — even though you’ve optimised nothing on the site. If you add an aggressive exit-intent popup with a manufactured urgency timer, you might spike your conversion rate in week one while simultaneously damaging customer trust, increasing return rates, and lowering the lifetime value of every customer that popup captured.
Neither of those scenarios reflects genuine CRO success. They’re denominator manipulation and short-term pressure, respectively — and any honest assessment of conversion performance has to account for both.
What sophisticated CRO programmes track alongside conversion rate:
- Revenue Per Visitor (RPV): Total revenue divided by total visitors. This metric captures both conversion rate and average order value simultaneously, making it far more resistant to manipulation and far more correlated with actual business outcomes.
- Cohort-Level LTV Impact: Before permanently rolling out a test winner, enterprise CRO programmes track whether the customers acquired through the winning variant show the same lifetime value as historical cohorts. A variant that increases conversions by attracting lower-quality customers can damage the business at a 6–12 month horizon even while looking like a win at 30 days.
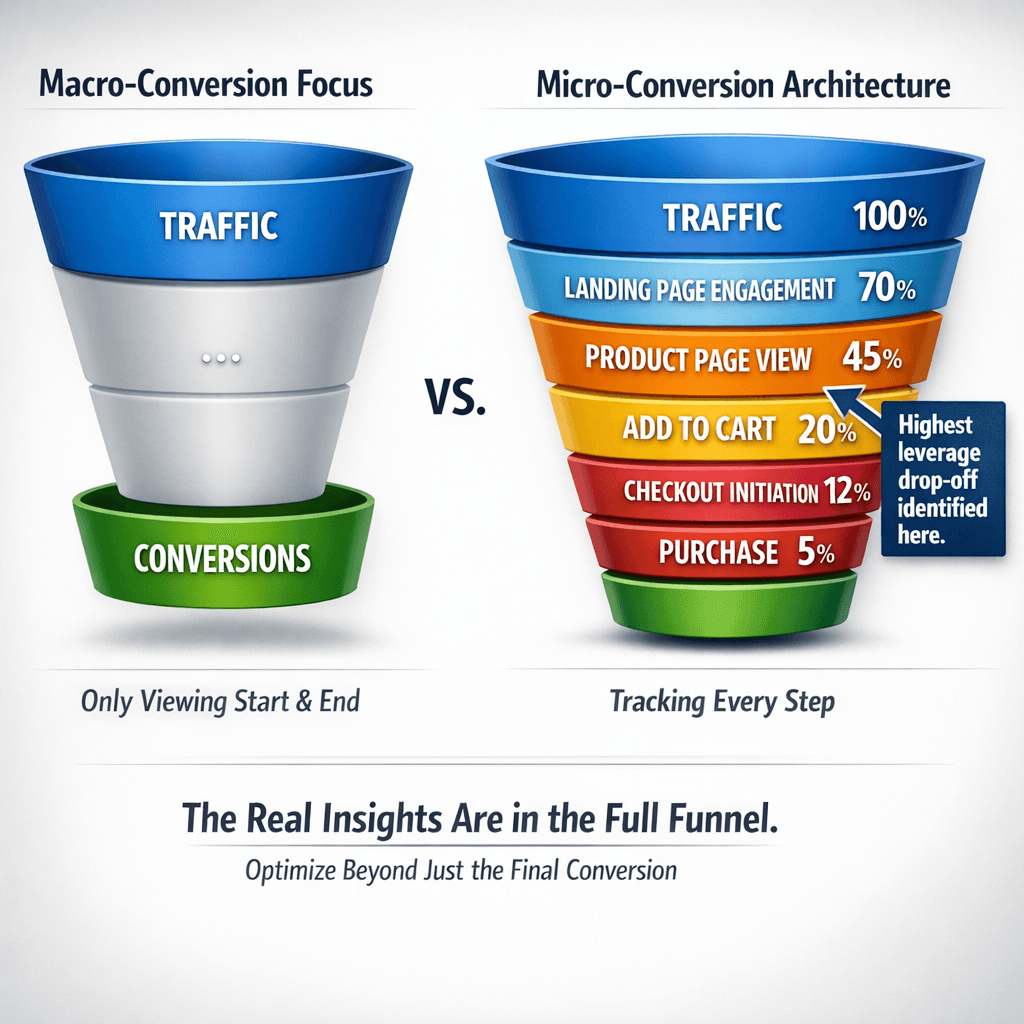
- Micro-Conversion Completion Rates: Measuring drop-off at each individual funnel stage — not just the final conversion event — to identify where the highest-leverage optimisation opportunities actually live. A 10% improvement in the product page to cart step is frequently more impactful than any homepage redesign.
This framing doesn’t make CRO more complicated. It makes it more honest about what you’re actually trying to achieve: not a higher number on a dashboard, but more revenue from the same traffic, without compromising the customer experience that drives repeat business.
Why CRO Fails Before a Single Test Is Run
Most CRO programmes fail at the organisational level, not the tactical level. This is the conversation the standard CRO content never has, and it’s worth addressing directly because it determines whether any of the technical work that follows will have the conditions to succeed.
The Siloed Data Problem
Effective CRO requires connecting behavioural data (what users do on the site), attitudinal data (what they say about the experience), and business outcome data (what actually drives revenue and retention). In most organisations, these data sets live in different teams with different tools and different reporting lines. The analytics team owns on-site behavioural data. The customer success or support team holds the qualitative feedback. Finance owns the revenue and LTV numbers.
Without a deliberate effort to connect these data sources, a CRO programme is running on partial information by definition. Teams end up optimising for metrics they can measure rather than metrics that matter — a pattern that produces local maxima rather than genuine performance improvements.
The Incentive Misalignment Problem
CRO requires patience. A rigorous test needs sufficient sample size, a clean testing window, and a holdout period to confirm wins aren’t driven by novelty effects. In organisations where marketing teams are measured on monthly conversion rate targets, there is constant structural pressure to call tests early, ship “winners” before they’re validated, and prioritise quick tactical changes over the slower, higher-value research work that generates genuinely durable improvements.
This is not a people problem. It’s a systems problem. And it’s one of the primary reasons that organisations with significant investment in CRO tools and headcount still see low rates of statistically significant test wins.
The Pre-Test Research Stack: Where 80% of the Work Belongs
Here is the ratio inversion that separates high-performing CRO programmes from the rest: the majority of the work should happen before any test is run.
Running A/B tests without a rigorous pre-test research phase is the primary reason most CRO programmes see less than 20% of tests produce statistically significant winners. You’re not testing bad ideas because your team isn’t smart — you’re testing bad ideas because you haven’t done enough work to understand why users are behaving the way they are.
The research stack below gives you that understanding.

Friction Log Methodology
A friction log is what you get when you have real users — not your internal team — narrate their experience aloud while attempting to complete a goal on your site. The purpose is to capture the micro-moments of hesitation, confusion, and frustration that aggregate behavioural data smooths over.
Heatmaps tell you where users clicked. Session recordings show you what they did. Neither tells you what they were thinking at the precise moment they almost converted and didn’t. Friction logs do. Five well-run friction log sessions will generate more actionable hypothesis material than months of heatmap analysis, because they connect observable behaviour to the cognitive state that produced it.
Exit Survey Triangulation
Exit surveys have a methodological limitation that most practitioners ignore: people are not reliable narrators of their own decision-making. When someone says they’re leaving because “it was too expensive,” they may actually have left because they didn’t trust the site enough to enter their payment details. The price was the rationalisation, not the cause.
This is why exit survey data should always be triangulated against on-page behavioural data. If users are citing price as the exit reason but your analytics show them spending significant time on the pricing page before bouncing, price presentation may genuinely be the issue. If they cite price but you see them bouncing immediately on product pages without ever reaching pricing, something earlier in the funnel is breaking trust — and your exit survey is pointing you in the wrong direction.
Jobs-to-be-Done Interview Framework
Jobs-to-be-Done is a research framework built on a deceptively simple premise: people don’t buy products, they hire them to do a job. The “job” is the progress a person is trying to make in a specific circumstance.
A user arriving at a project management software landing page isn’t just “a SaaS prospect.” They might be a founder who just had a team communication breakdown and is desperately looking for a way to prevent it from happening again. The emotional context, the triggering event, and the specific outcome they want are all part of the job — and none of that is visible in your analytics.
JTBD interviews surface hypothesis ideas that pure data cannot generate, because they reveal the causal mechanism behind purchase intent rather than just the demographic or behavioural profile of who converts.
Rage-Click and Dead-Click Analysis
Rage clicks — users clicking repeatedly on an element in rapid succession — signal that something is not working as expected. Dead clicks — interactions with elements that have no functionality — signal that users believe something should work that doesn’t.
Both are leading indicators of expectation mismatch, and neither appears in standard analytics. Your Google Analytics dashboard will not tell you that 18% of users are clicking on a product image expecting it to enlarge, finding that it doesn’t, and leaving the page. Your heatmap will suggest those clicks are engagement. Only dead-click analysis tells you the truth.
The Statistical Reality of A/B Testing
A/B testing is the most discussed element of CRO and, because of that, the most misunderstood. The confidence with which most practitioners interpret test results is not warranted by the statistical rigour with which most tests are run.
This is not a minor technical footnote. It directly determines whether your CRO programme is generating genuine insight or an elaborate system for fooling yourself with data.
The Peeking Problem
The most common testing mistake in the industry is stopping a test as soon as it reaches statistical significance rather than at a pre-determined sample size. It feels like the right move — significance has been reached, the winner is clear, why run the test longer and delay the improvement?
The answer is the multiple comparisons problem. Every time you check your results mid-test, you are effectively running a new hypothesis test on the same data. The more times you look, the higher the probability that you’ll observe a “significant” result by random chance alone. Research on this pattern shows that peeking at test results even a handful of times can push your actual false positive rate well above your stated significance threshold.
The practical solution is to calculate your required sample size before running the test, commit to that sample size, and not evaluate results until it’s reached. Sequential testing methods — including Bayesian approaches and always-valid confidence sequences — offer more sophisticated frameworks for programmes that need interim decision-making capability.
Minimum Detectable Effect and Statistical Power
Most practitioners run tests without calculating the minimum sample size required to detect their expected effect size with adequate statistical power. This has two costly consequences.
First, small but real improvements are routinely declared “no result” because the test was underpowered — there wasn’t enough traffic to detect the effect even though it genuinely existed. These true improvements get discarded.
Second, genuinely worthless changes are declared “winners” on insufficient data because random variation within a small sample produced a significant-looking result. These false positives get shipped, fail to hold their gains, and erode confidence in the CRO programme.
Calculating required sample size before a test requires knowing your baseline conversion rate, your minimum detectable effect (the smallest lift you consider commercially meaningful), and your desired statistical power. There are reliable sample size calculators available for this purpose, and using them should be standard practice for every test, not an optional step.
The Novelty Effect
New experiences frequently produce temporary conversion lifts simply because they are different, not because they are better. Users engage with novel interface elements out of curiosity. Over time, as novelty fades, behaviour reverts. A test that ran for two weeks may have captured a novelty-driven lift that disappears entirely by week six.
Well-structured CRO programmes include holdout periods post-test — a window after the winning variant is shipped where a small percentage of users still see the original experience. If the winner’s performance degrades significantly once novelty fades, the holdout data catches it before permanent rollout.
Test Interaction Effects
Running multiple simultaneous tests on overlapping user segments contaminates results. If a user is exposed to two tests at once — say, a navigation change test and a product page layout test — their behaviour in each test is no longer independent. You cannot reliably attribute a conversion outcome to either test alone.
Enterprise-level CRO programmes address this with mutual exclusion frameworks: users are assigned to test segments in a way that prevents overlap, so no user sees more than one live test at a time. For lower-traffic sites where mutual exclusion would make test timelines unworkable, the practical solution is to run tests sequentially rather than simultaneously.
Hypothesis Prioritisation: The Work That Determines Your Win Rate
Research produces more hypothesis ideas than any programme can test. The quality of your prioritisation logic — deciding which ideas to test first — is a significant determinant of your programme’s overall win rate.
Two frameworks are widely used for this purpose.
The PIE Framework (Potential, Importance, Ease):
| Criterion | What It Measures | Scoring Guidance |
|---|---|---|
| Potential | How much room for improvement exists on this page or element, based on current performance data | High score: page has high traffic and poor completion rate. Low score: page is already performing near benchmark. |
| Importance | How much does this page or step contribute to overall revenue or conversion volume | High score: change affects a high-value funnel stage. Low score: change is on a low-traffic or low-impact page. |
| Ease | How much technical and resource effort is required to build and run the test | High score: minimal development work, can be run in current testing tool. Low score: requires significant build time or cross-team dependency. |
Each hypothesis is scored 1–10 on each dimension. The composite score determines testing queue priority.
The ICE Framework (Impact, Confidence, Effort):
The ICE framework introduces an explicit confidence dimension that PIE lacks — scoring how well the hypothesis is supported by existing research evidence. A hypothesis with a strong qualitative research backing scores higher on confidence than one based purely on intuition. This directly rewards the pre-test research investment described above: teams that do rigorous research generate higher-confidence hypotheses, which score higher in the ICE framework and therefore get tested with priority.
Both frameworks serve the same essential function: ensuring that your testing backlog is ordered by expected value, not by whoever argued loudest in the last team meeting.
User Psychology in CRO: Beyond the Trust Badge Checklist
Social proof and trust signals appear in virtually every CRO article published. They’re listed as tactics, noted as effective, and offered without meaningful context for when they work, when they don’t, and why the cognitive mechanisms behind them matter for implementation.
Why Social Proof Works — And When It Backfires
Social proof operates on the principle of informational social influence: in conditions of uncertainty, people look to the behaviour of others as evidence of the correct action. A product with 4,000 reviews signals that many people have made this decision before and found it reasonable. That signal reduces the cognitive cost of deciding.
The backfire condition is a low count signal. A product with three reviews — even three positive ones — can perform worse than a product with no review count displayed at all, because three reviews communicates “very few people have bought this,” which triggers the opposite of the intended effect. The lesson is not “add social proof.” It’s “add social proof only when the volume and quality of that proof is strong enough to produce a positive signal.”
The same logic applies to trust badges. A site covered in six different trust seals communicates security anxiety rather than security confidence — it raises the question of why so much reassurance is needed, which is the precise opposite of trust-building.
Sequencing Psychological Triggers Across the Funnel
Users at different funnel stages have different psychological needs, and the triggers that persuade at one stage can create friction at another.
A first-time visitor landing on a category page is in an exploratory mindset. The appropriate psychological lever here is curiosity and framing — presenting choice architecture in a way that guides exploration toward high-value products without creating decision paralysis.
A user who has added a product to cart and initiated checkout is in a commitment mindset. They’ve largely decided. The psychological risk at this stage is loss aversion — abandonment is often triggered by a single piece of friction (an unexpected fee, a mandatory account creation step) rather than reconsidering the product itself. The optimisation lever here is friction removal, not persuasion.
A returning visitor who has purchased before is in an entirely different psychological frame again. The appropriate lever is recognition, status, and continuity — reinforcing that they made the right decision last time and reducing the cognitive load of deciding again.
Treating social proof and persuasion as a homepage checklist ignores the stage-specific psychology that determines whether those elements actually convert.
The CRO and SEO Tension: A Conflict Most Guides Ignore
One practical consideration that receives almost no attention in standard CRO content is the direct tension that can exist between conversion optimisation and SEO performance.
Removing informational content from a landing page to simplify the layout and improve conversion rate can simultaneously destroy the organic keyword coverage that made the page rank in the first place. Restructuring a page for CTA prominence can create a layout that search engines flag as intrusive or low-quality. Implementing overlays and pop-ups that improve email capture rates can damage Core Web Vitals scores and affect organic ranking performance.
These are not hypothetical conflicts. They are regular trade-off decisions that any serious CRO programme will encounter, and resolving them requires explicit communication between whoever manages SEO and whoever manages CRO — something that rarely happens in organisations where these functions report to different teams. Our article on SEO for Lead Generation 2026: What Actually Drives Pipeline covers how organic search strategy intersects with revenue performance in more detail.
The resolution framework is straightforward: before implementing any significant page change driven by CRO findings, run it through an SEO impact assessment. Identify which organic keywords the current page ranks for, which content elements contribute to that ranking, and whether the proposed change removes or restructures those elements. If there’s a conflict, the decision becomes a business prioritisation question — not a default to either discipline.
Mongoose’s advantage as a full-service agency is that this conversation happens internally, between specialists working toward the same client outcome, rather than across organisational silos where each team is protecting its own metrics.
Strategic Recommendations for 2026
The discipline of conversion rate optimisation is maturing rapidly, and the tools and approaches that will define serious programmes over the next twelve to eighteen months reflect that maturity. Three specific directions are worth prioritising.
1. Behavioural analytics platforms with session intelligence
Move beyond standard heatmapping into platforms that combine session recording with AI-assisted pattern recognition — tools that can surface anomalies in user behaviour at scale rather than requiring analysts to watch recordings manually. Platforms in this category can identify friction points across thousands of sessions and flag statistically significant behavioural clusters, reducing the time between data collection and testable hypothesis. For 2026, the differentiator is not whether you are recording sessions, but whether you have the analytical layer to extract signal from that data efficiently.
2. Server-side testing infrastructure
Client-side A/B testing — where the experiment logic runs in the browser — introduces latency, flicker, and increasing vulnerability to ad blockers and privacy-focused browsers that strip or delay JavaScript execution. Server-side testing moves experiment logic to the server before the page is delivered, eliminating visual flicker entirely and producing cleaner data unaffected by client-side interference. As third-party cookie deprecation continues and browser privacy defaults tighten, server-side infrastructure becomes less optional and more foundational for any programme running sustained experimentation.
3. Structured CRO and SEO integration reviews
As outlined in the preceding section, the tension between conversion optimisation and organic search performance is a genuine and undermanaged risk. The practical recommendation for 2026 is to formalise this as a process rather than an ad hoc conversation. Before any significant page restructure, a documented cross-discipline review — assessing organic ranking dependencies, content coverage, and Core Web Vitals implications — should be a standard gate in the implementation workflow. Organisations that treat this as a formal checkpoint will avoid the pattern of CRO wins that quietly erode organic traffic over the following quarter. For a deeper look at the technical factors that affect search visibility, the article on hidden website issues that kill Google rankings is worth reviewing alongside any CRO implementation plan.
Frequently Asked Questions
What is conversion rate optimisation and how is it different from general marketing?
Conversion rate optimisation (CRO) is the systematic process of increasing the percentage of users who complete a desired action on a website or digital asset — whether that is making a purchase, submitting an enquiry, or signing up for a service. Unlike general marketing, which is primarily concerned with generating traffic and building awareness, CRO focuses exclusively on what happens after a visitor arrives. It uses behavioural data, structured experimentation, and user research to identify why visitors are not converting and to test changes that address those specific barriers. The two disciplines are complementary — CRO makes the traffic that marketing generates more valuable — but they operate on different parts of the customer journey and require different methodologies.
How long does it take to see results from a CRO programme?
Meaningful results from a structured CRO programme typically emerge over a period of three to six months, though this depends heavily on the volume of traffic available for testing. A/B tests require sufficient sample sizes to reach statistical significance — sites with lower traffic volumes will need longer testing windows to produce reliable conclusions, and running experiments for too short a period risks decisions based on noise rather than genuine user behaviour. Early wins from quick technical fixes or obvious friction removal can appear sooner, but the compounding improvement that defines a mature CRO programme — where each test informs the next — develops over sustained cycles of experimentation, analysis, and iteration.
Can CRO work against SEO performance?
Yes, and this is one of the most commonly overlooked risks in CRO implementation. Changes made to improve conversion rate — such as removing informational content to simplify a page, restructuring layouts for CTA prominence, or adding overlays for lead capture — can simultaneously reduce organic keyword coverage, create page experience signals that search engines interpret negatively, or damage Core Web Vitals scores that influence ranking. The conflict is not inevitable, but it is common enough that any serious CRO programme should include a formal SEO impact assessment before implementing significant page changes. Organisations where CRO and SEO are managed by separate teams with separate reporting lines are particularly vulnerable to this problem, as neither team has full visibility of the trade-offs being made.
What is statistical significance and why does it matter in CRO testing?
Statistical significance is a measure of confidence that the result observed in an experiment reflects a genuine difference in user behaviour rather than random variation. In the context of CRO, it answers the question: if variant B outperformed variant A during the test, how confident can we be that this difference would persist if we implemented the change permanently? A result is conventionally considered statistically significant when confidence reaches 95% or above, meaning there is only a 5% probability the observed outcome was due to chance. Running tests for too short a period, or calling a winner before reaching significance, leads to false conclusions — implementing changes that appear to work in the test data but produce no lasting improvement, or that actively harm performance after full rollout.
Is CRO only relevant for e-commerce websites?
No. While e-commerce provides the clearest conversion metrics — purchase completion rates, basket abandonment, checkout drop-off — the principles of CRO apply to any digital environment where user behaviour can be measured and a desired action can be defined. B2B organisations optimise for enquiry form submissions, demo requests, and content downloads. Professional services firms optimise for consultation bookings and contact page completions. SaaS products optimise for trial sign-ups, onboarding completion, and feature adoption. The methodology — identifying friction, forming hypotheses, testing changes, and measuring outcomes — is consistent regardless of sector. What changes is the conversion event being targeted and the longer, more complex decision-making journey that typically characterises non-e-commerce contexts.
What is the difference between A/B testing and multivariate testing?
An A/B test compares two versions of a page or element — the original (control) and a single variation — to determine which performs better against a defined metric. Multivariate testing simultaneously tests multiple elements and multiple variations of each, allowing the experiment to identify which combination of changes produces the best outcome. Multivariate testing is more powerful in theory but requires substantially higher traffic volumes to reach significance, because the audience must be split across a larger number of combinations. In practice, most CRO programmes rely primarily on A/B testing because it is more tractable for sites with moderate traffic levels, produces cleaner cause-and-effect insights, and allows for faster iteration cycles. Multivariate approaches are best reserved for high-traffic pages where the interaction effects between multiple elements are the specific question being investigated.
Conclusion
Conversion rate optimisation, practised seriously, is neither a checklist of best practices nor a collection of persuasion techniques applied uniformly across a site. It is a disciplined, evidence-driven process — one that demands rigour in data collection, intellectual honesty in how test results are interpreted, and enough commercial judgement to distinguish changes that produce lasting performance improvement from those that simply move a metric in the short term.
The organisations that extract durable value from CRO are those that treat it as an ongoing programme rather than a project, that integrate it properly with the adjacent disciplines of SEO, analytics, and paid media, and that build the internal processes to act on what the data actually shows rather than what they expected it to show. If you’re also evaluating how to make your marketing budget work harder across the full funnel, the article on building a data-driven digital marketing strategy for local service businesses offers a useful complement to the CRO principles covered here.
If your organisation is ready to approach conversion performance with that level of seriousness, we would welcome the conversation.